


The dashboard development company specializes in creating effective dashboards to monitor your business’s performance. You and your team can access complex data directly, removing the need to navigate through multiple spreadsheets or reports. Data visualization features include charts, graphs, and interactive infographics.
Software providers offer business dashboards development services, building custom solutions designed with adaptability in mind. Analytics dashboards enable companies to tailor data insights to their specific needs, to identify trends, patterns, and outliers without time-consuming efforts. As a result, companies have the option to make informed business decisions using accurate data analysis.
Business intelligence, as a set of dashboard data strategies and technologies you choose to implement, can give you a significant advantage over competitors, save time, and put in order the chaotic marketing efforts of your staff. Whether you want to improve marketing campaigns, track progress or sales, or understand customer preferences or employee performance, dashboard development gives you the insights you need to do well in today’s data-focused market.
Data Analytics Dashboard Glossary
| Dashboard
development process |
Dashboard is a visual interface presenting metrics and performance indicators. Users can track, analyze, and get reports in real-time. Dashboards often include infographics and tables to present relevant datasets. |
| KPI | A measurable value indicates how effectively your business achieves business objectives. |
| Data Visualization | It’s a graphical representation of information and data using visual elements to identify patterns, trends, and outliers. |
| Data Mining | It’s the process of discovering patterns, correlations, and trends in large data sets using statistical and computational techniques. |
| Business Intelligence (BI) | BI refers to technologies, processes, and tools used to collect, analyze, and present business information. |
| Drag-and-Drop for Dashboard | A drag-and-drop feature enables users to easily customize the layout of visual elements (charts, graphs, or widgets) by dragging them to any desired position. |
| Out-of-the-Box Dashboard | It refers to a pre-built, ready-to-use dashboard with standard features, visualizations, and configurations. It’s designed to work immediately upon installation or deployment without requiring extensive customization. |
| Widget Library | A widget is a self-contained component or element within a dashboard displaying specific information or functionality. Widgets can include charts, graphs, gauges, tables, and text boxes. They are customizable and can be arranged on a dashboard for convenient use. As a user, you can pick a widget in the library that the LaSoft team developed and add it to your out-of-the-box analytic dashboard. |
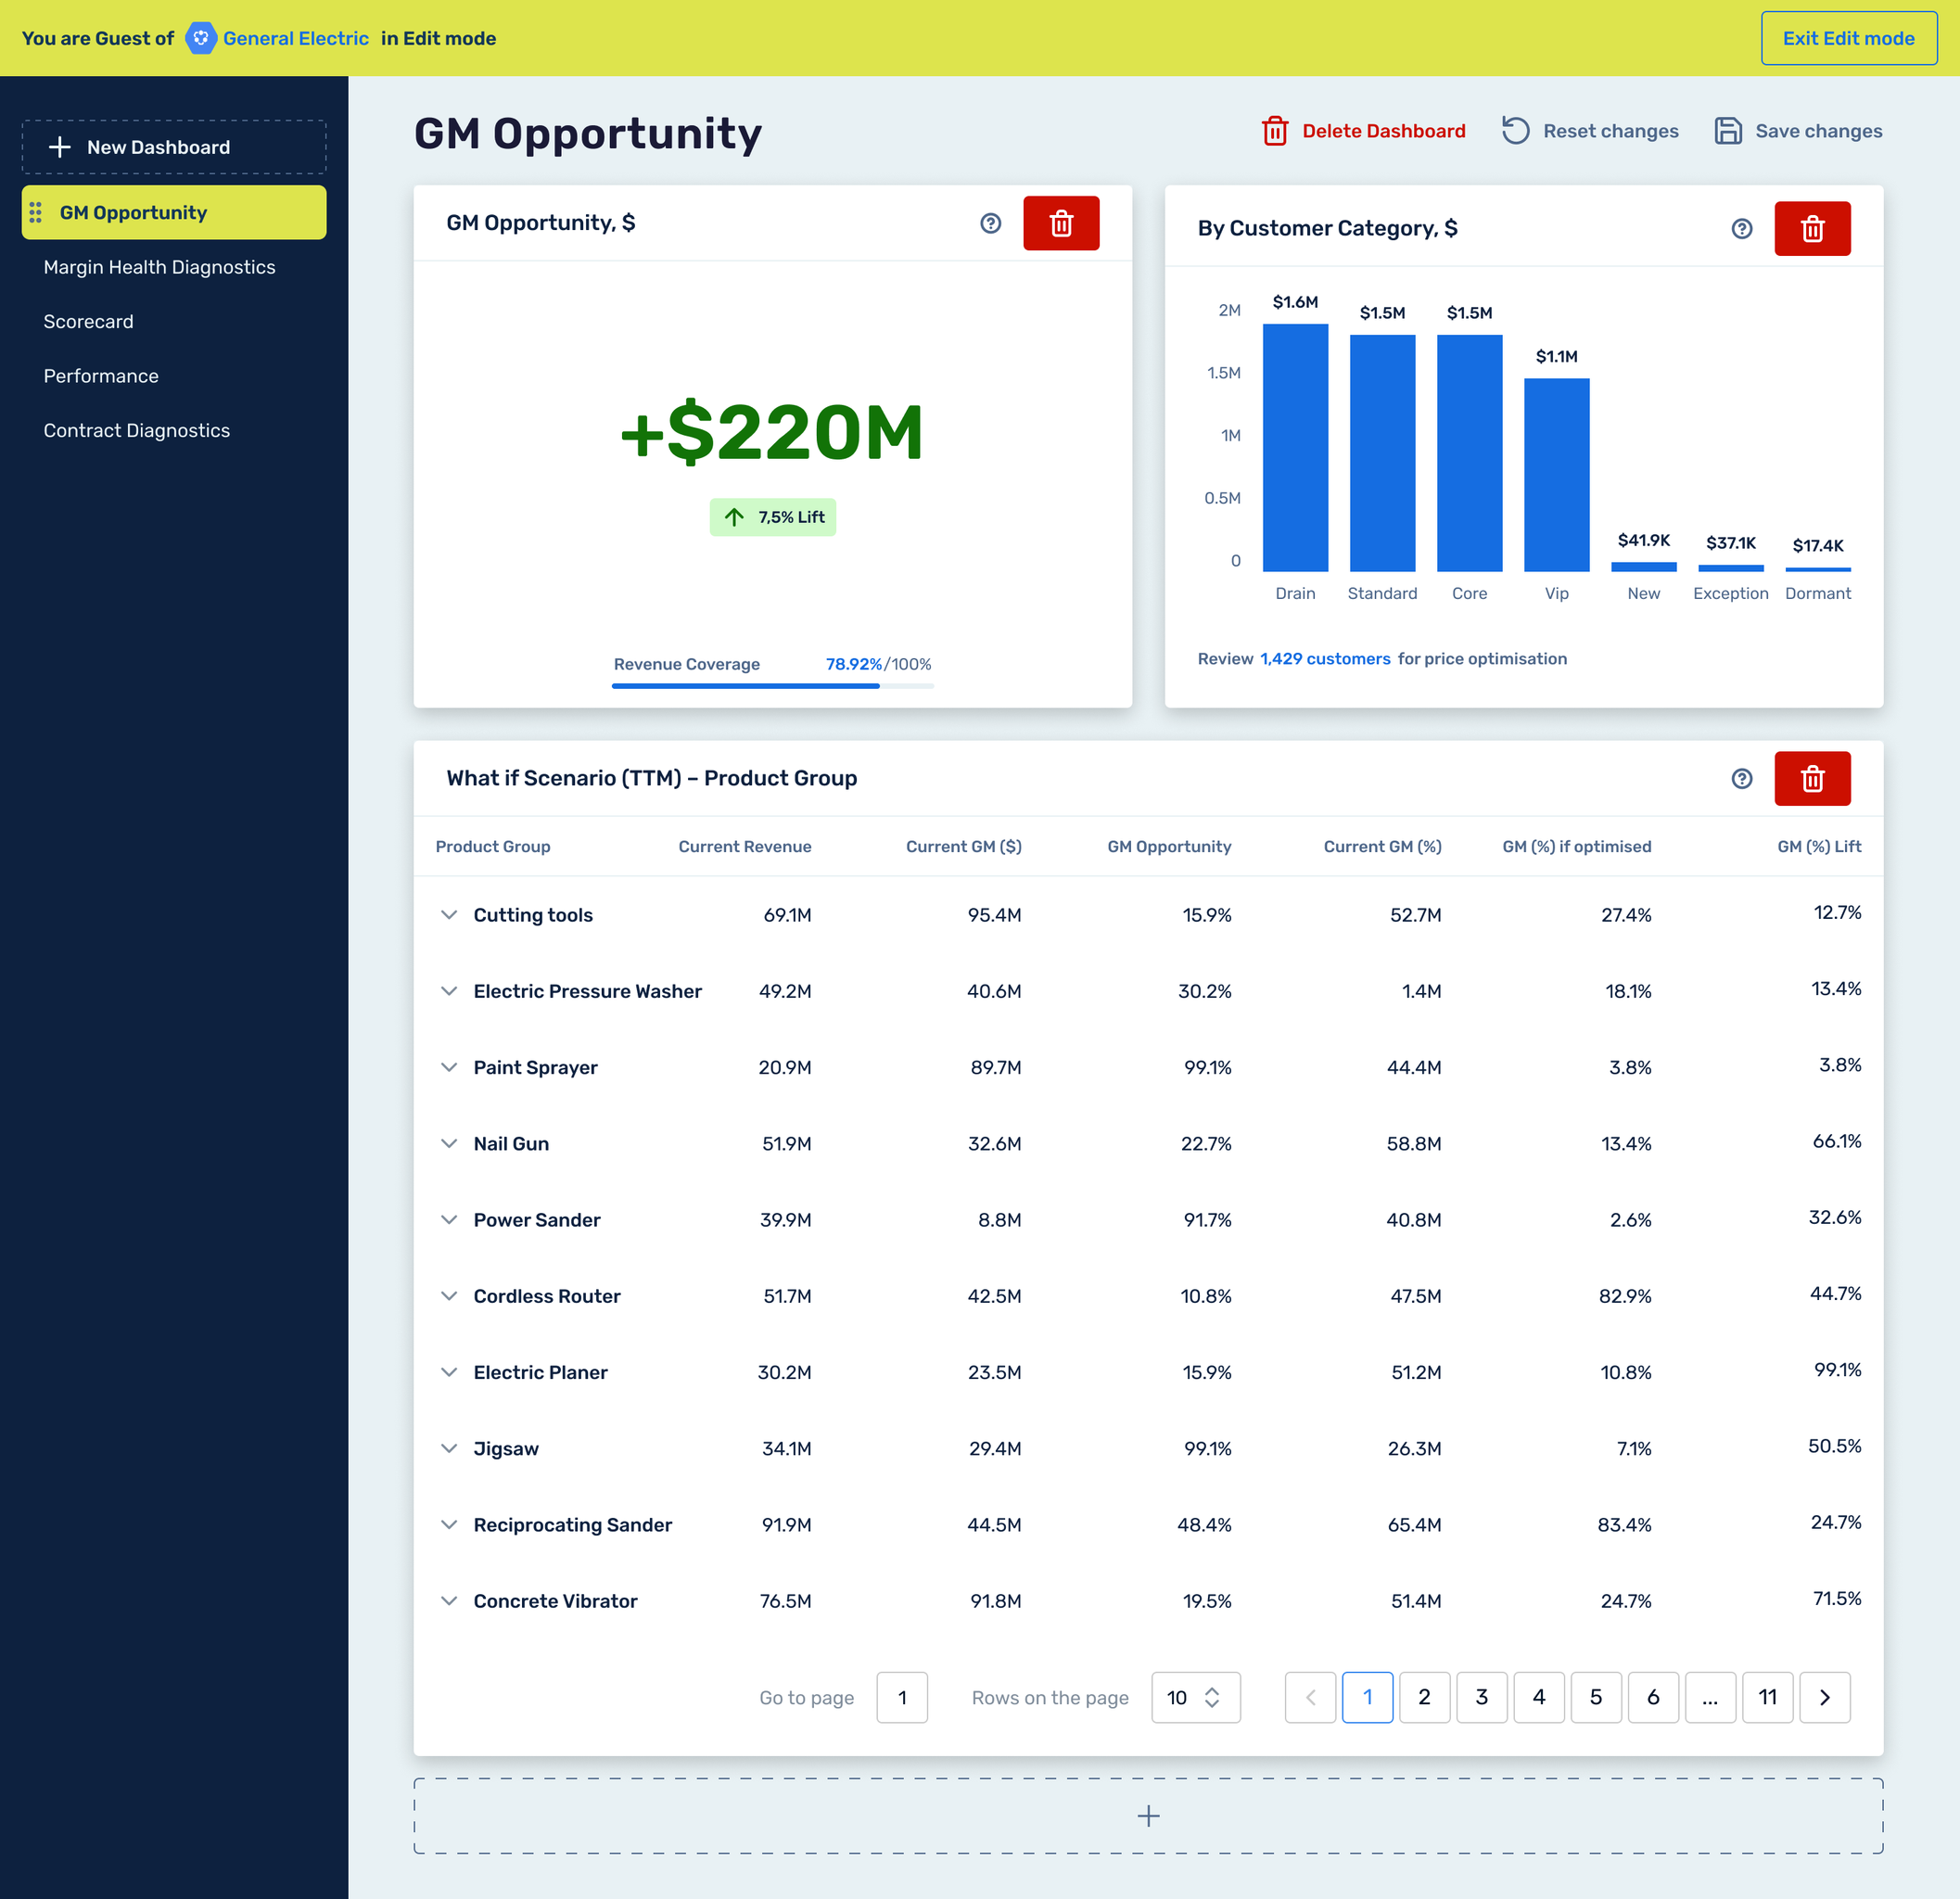
Out-of-the-Box Dashboard Constructor by LaSoft
From our experience, we know how the expert analysis of KPIs drives many processes and interactions with our customers. The LaSoft team has developed an out-of-the-box and ready-to-use analytics dashboard system that provides companies in various industries with an efficient way to visualize their data. Your managers can stop searching multiple platforms to get an all-in-one solution to assess business performance.
The LaSoft team offers a solution ideal for companies seeking business intelligence tools without the lengthy and expensive custom dashboard development process. DataPoint is an AI-enabled, low-code dashboard solution designed for business users who need to gain insights without building from scratch. This solution is complete with a widget library that enables customization or modification of boards as required.
Why Your Business Might Need Our Interactive Dashboards?
With our dashboard development services, team members involved in different company projects get access to accurate visual data reports. Getting actionable insights makes it easier to collaborate, align on strategies, and implement real-time changes when necessary. Let’s discover some data analytics dashboard examples for different businesses.
Small to Medium-Sized Enterprises (SMEs): businesses that need robust data analytics but want to save significantly on resources by building a customizable dashboard from scratch.
Marketing Agencies: requiring marketing dashboard integration, quick data insights, and visualizations for traffic sources, social media platforms, their clients’ campaigns, and outcomes.
E-commerce Stores: Companies seeking real-time insights turn to sales dashboard solutions that provide customer behavior and inventory insights without the complexity of a custom dashboard.
Finance and Accounting Businesses: an informative way to track financial performance and KPIs without extensive development work with our financial dashboards.
Insurance Businesses: the insurance industry handles large volumes of risk assessment and claims data. Our custom dashboard development helps visualize complex data to identify patterns, trends, and potential risks. By analyzing customer data, insurers can segment their client base to tailor policies, marketing efforts, and customer service.
Human Resources (HR): a dashboard example for HR teams that monitor employee performance metrics, such as productivity, attendance, and training progress. Dashboards can also help visualize key recruitment metrics, such as time-to-hire, cost-per-hire, retention rates, and employee satisfaction, thereby enabling data-driven decisions on workforce planning and development.
Benefits of the Operational Dashboard by LaSoft
Our dashboard development company offers a solution for integration into your company’s platform, enabling you to track metrics from multiple sources, large datasets, and transform raw data into visually appealing dashboards with valuable insights.
Out-of-the-Box Solution
We present an out-of-the-box dashboard constructor that may show metrics and real-time data, helping management and stakeholders choose the right direction for their efforts and make data-driven decisions. This dashboard system visualizes analytics based on specific requirements, eliminating the need for long development cycles and allowing immediate use.
The solution also comes with role and access settings to control who can view and how metrics and reports are accessed. Different departments and teams can have customized views that reflect only the data and widgets relevant to them, which reflect meaningful insights. This granular control improves security and ensures that sensitive information is only accessible to authorized team members.
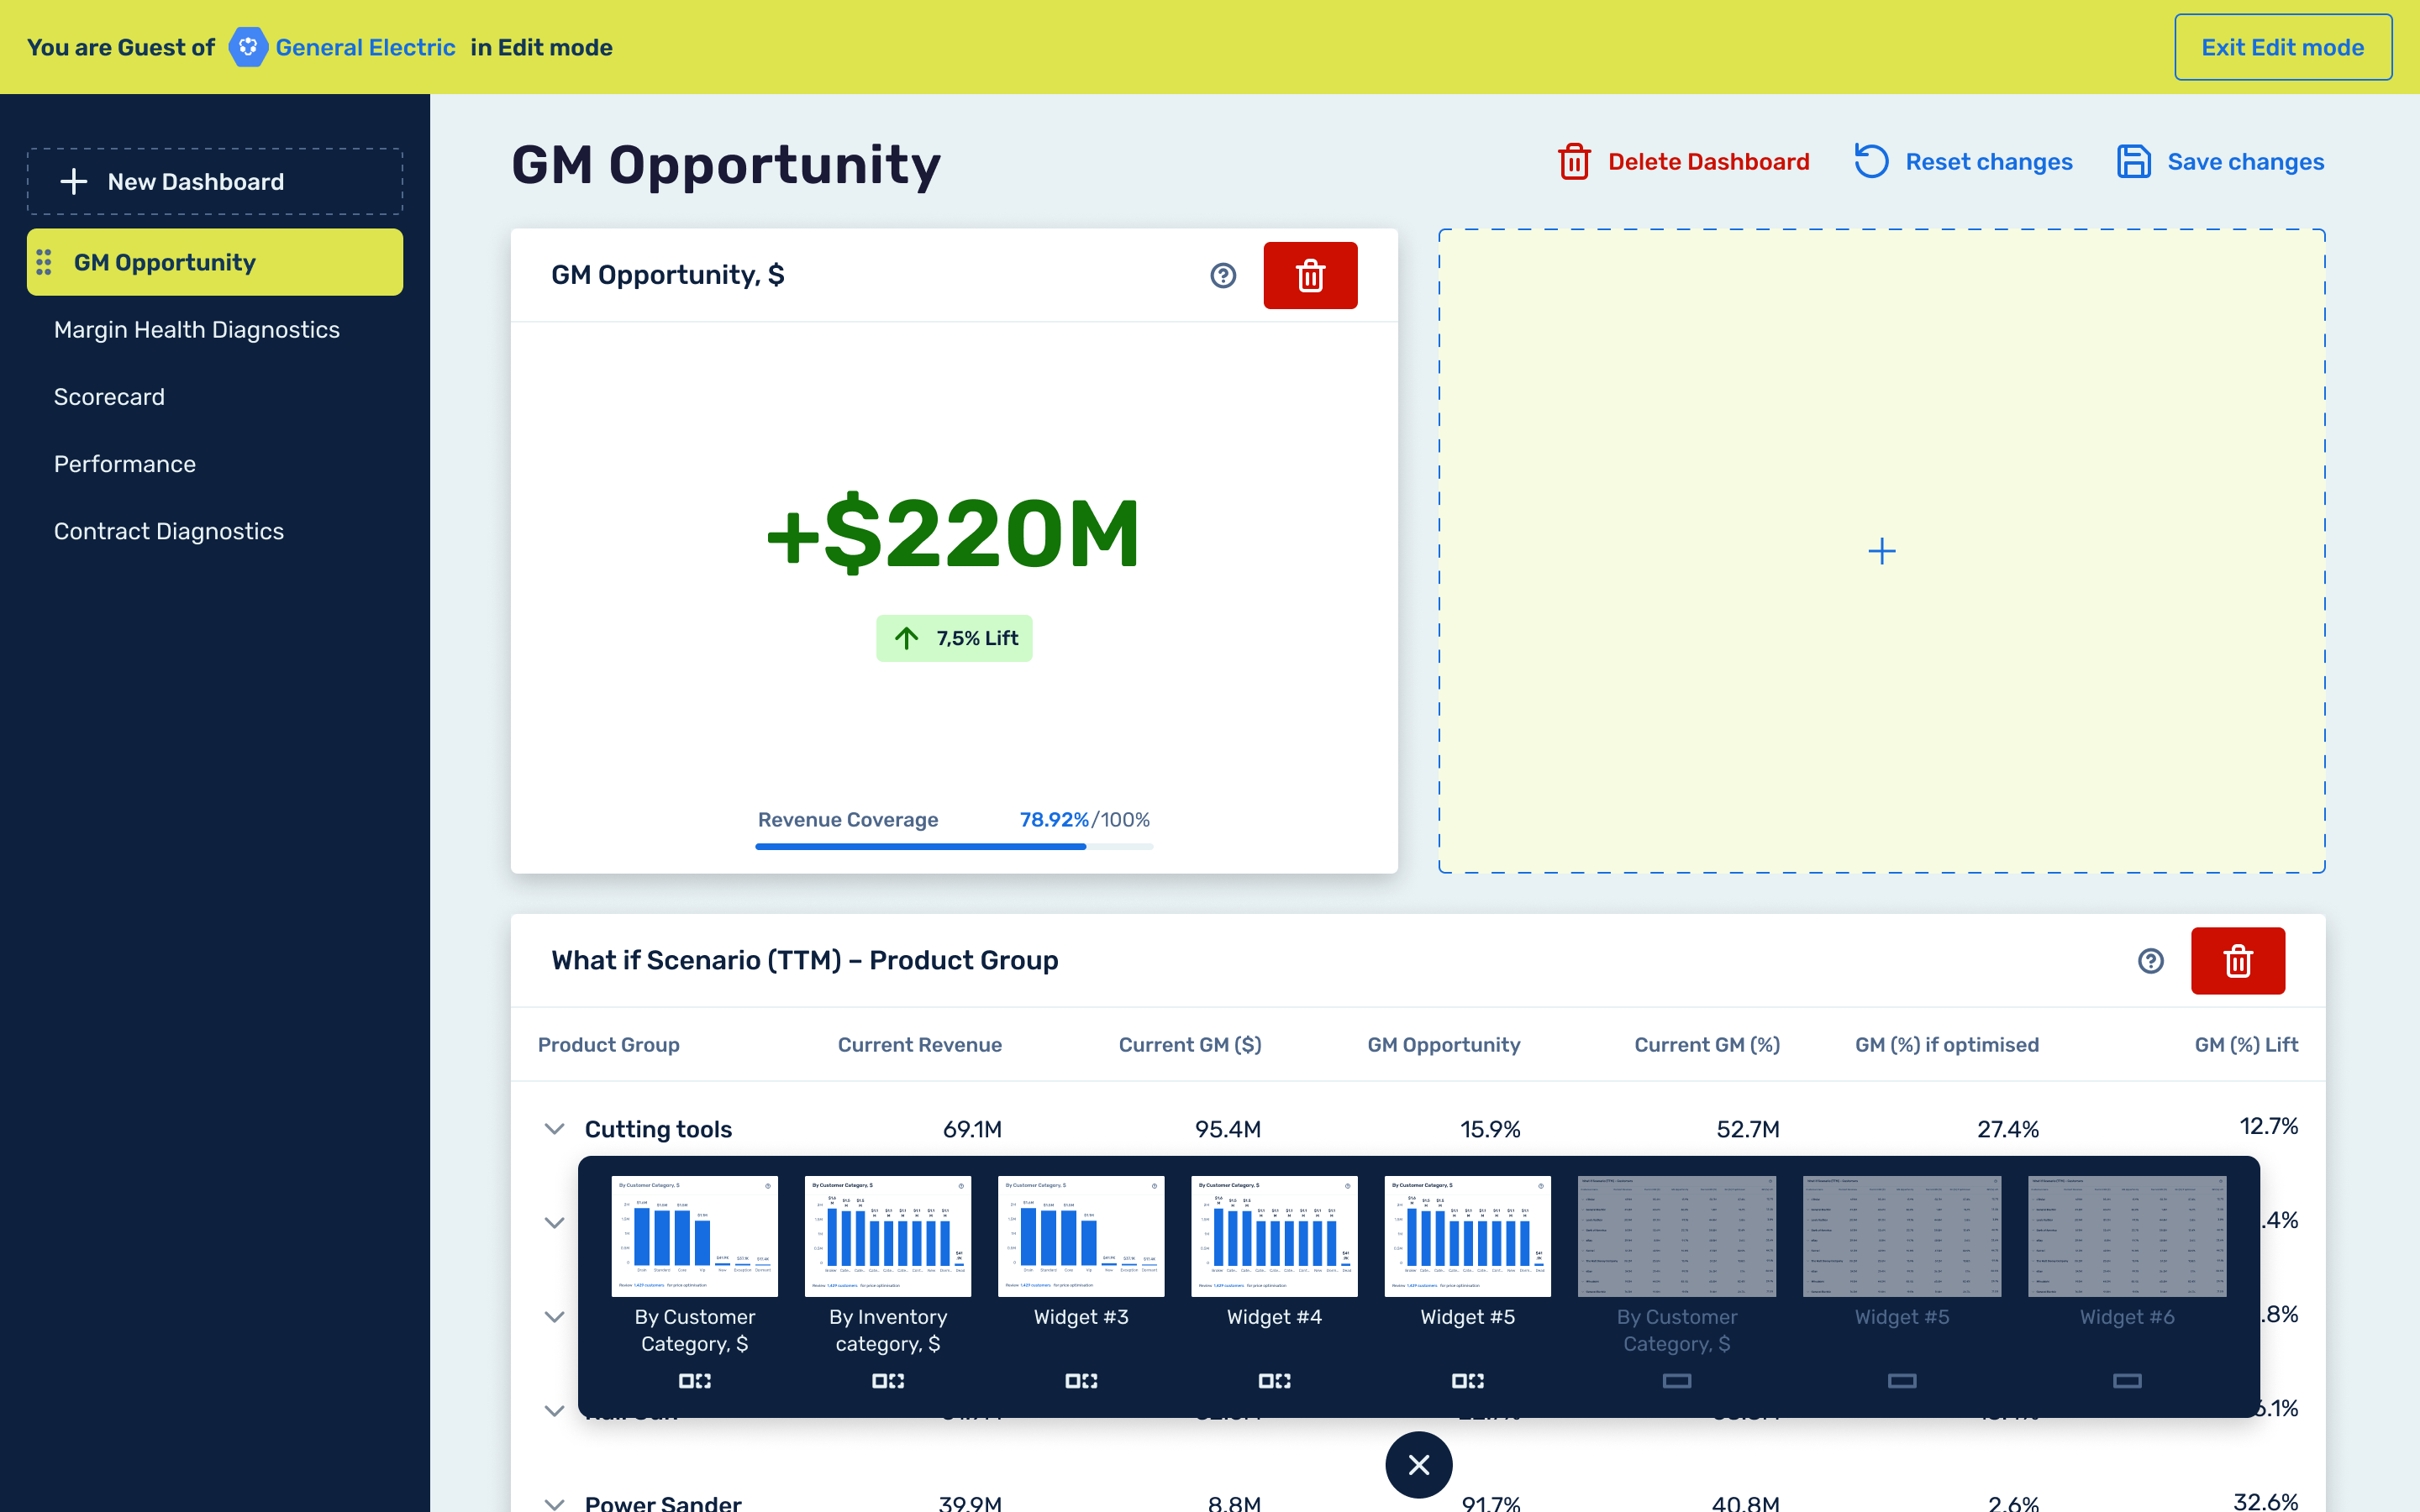
Custom Widget Library
This option offers a library of custom widgets to create the most effective visual representations of the company’s data. This flexible solution helps customize reports and analytics without coding from scratch.
Customizable widgets that clearly and intuitively display data with required essential metrics, such as sales figures, performance indicators, financial data, track progress, or any other business-critical information.
The Lasoft team can create widgets based on specific requirements, ensuring that the displayed data is always relevant with real-time data updates. Once created, these widgets are stored in a widgets library, making them available for reuse or adaptation across multiple dashboards and users.
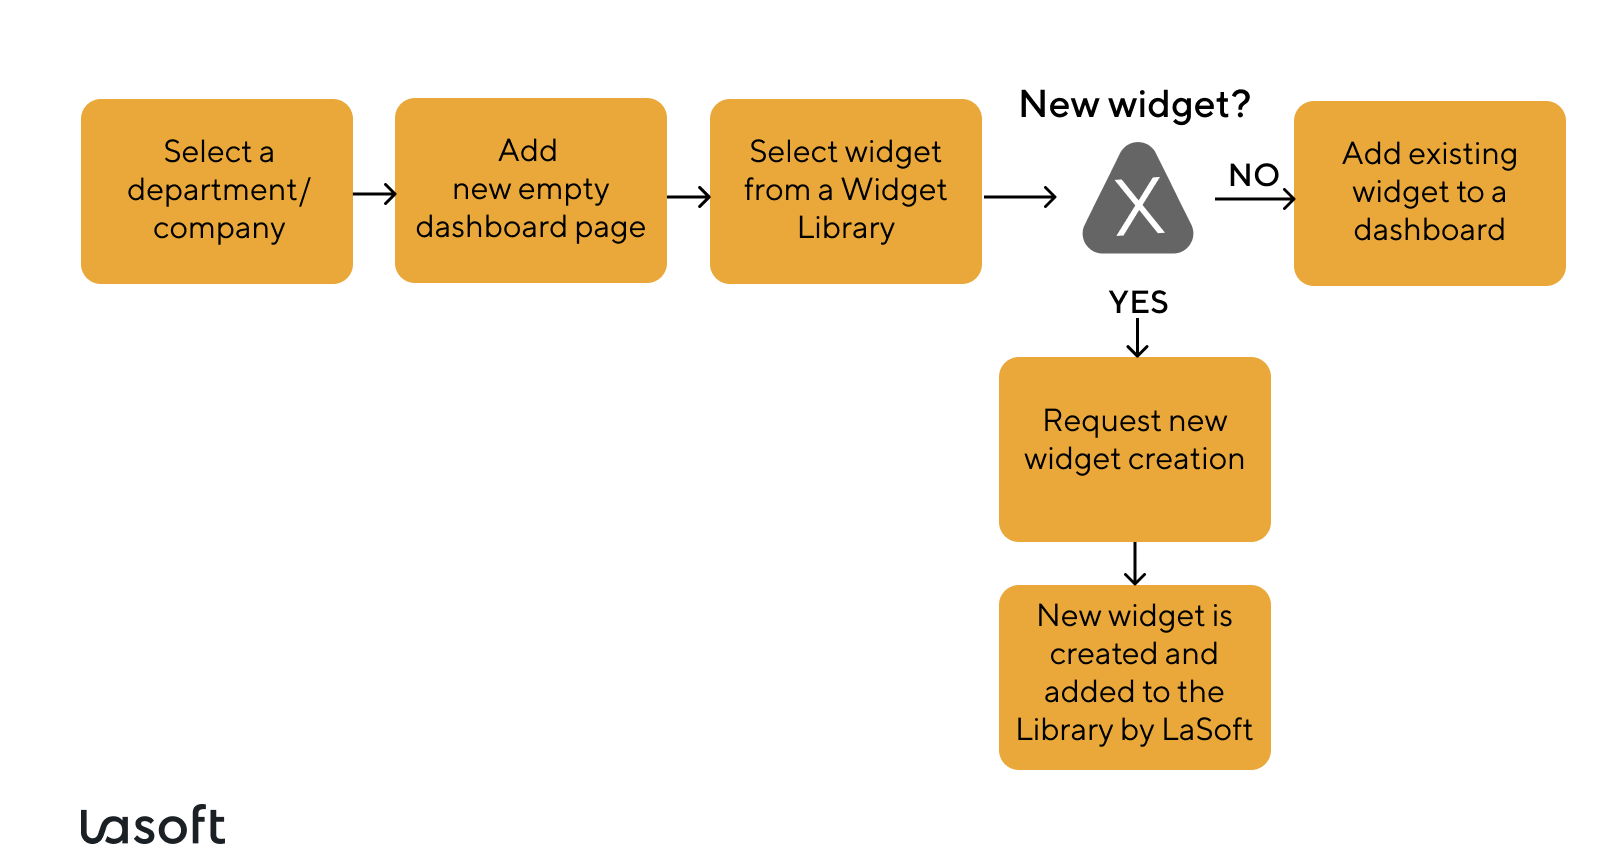
Flow of the Widget Creation Process
Drag-and-drop Interface
LaSoft has developed dashboards, which include a well-thought-out constructor for creating and modifying dashboards easily with the help of widgets. The intuitive drag-and-drop interface simplifies organizing them on your desktop according to your specific preferences.
Fast Implementation and Seamless Integration
Another key advantage is avoiding time-consuming and pricey development from scratch, making it ideal for businesses needing fast deployment to stay competitive.
The analytics dashboard constructor can be easily integrated with the client’s database. The LaSoft team ensures that data flows seamlessly into your project dashboard with any system you use, such as SQL databases, cloud storage, or other proprietary systems.
What is a Data Analytics Dashboard for Business?
A data analytics dashboard is a visualization tool that combines data and displays logically organized key performance indicators (KPIs), which are essential for actionable insights and measuring business success. Dashboards enable cross-team collaboration by sharing data with other team members or management teams and stakeholders. Many companies are adopting data analytics to increase revenues, enhance their analytics capabilities, and improve risk management.
The global data analytics market was valued at USD 30 billion in 2022 and is expected to exceed USD 393.35 billion by 2032, growing at a compound annual growth rate (CAGR) of 29.4% from 2023 to 2032.
Source: Precedence research
Out-of-the-Box Dashboard Constructor
A pre-built dashboard tool that offers ready-to-use templates and features for creating data visualizations without the need for custom coding or extensive setup. It usually includes drag-and-drop widgets, standardized reporting formats, and integration with popular data sources like CRM, ERP, Google Analytics Dashboard, and more.
Typically, small to medium—sized companies or teams buy these solutions because they need to deploy them to gather key metrics quickly.
| Criteria | LaSoft’s Out-of-the-Box
Dashboard Constructor |
Customized Analytics Dashboard |
| Setup Time | Faster implementation | Requires significant development time, typically weeks or months |
| Cost | Lower upfront cost | Higher upfront cost due to custom development from scratch |
| Customization | Offers customization options (pre-built templates) | Customizable to specific business needs and KPIs |
| Ease of Use | Easy to use drag-and-drop functionality | Requires development and technical skills |
| Scalability | Depends on the features of the solution. Ask the developer | Highly scalable, able to grow and adapt to business requirements |
| Data Integration | Integrates with common data sources (e.g., CRM, ERP, Google Search Console, and other digital marketing tools) | Can integrate with any data source, including custom and legacy systems |
| Advanced Analytics | Depends on the dashboard tools | Supports advanced analytics, AI, and machine learning models |
| Support and Maintenance | Vendor-provided support and updates | Requires dedicated internal or third-party support |
| Flexibility | Quite an impressive library of widgets offers various modifications | Completely flexible in terms of design, features, and metrics |
| Security | Standard security features based on vendor specifications | Could be more profound security protocols based on company requirements |
| Adaptability to Business Changes | Adaptability to changing needs or new metrics | Easily adaptable to changing business needs or new KPIs |
| Time to Market | Very quick—ideal for rapid deployment | Longer development timeline |
An out-of-the-box dashboard constructor is best for businesses needing quick, affordable solutions for basic reporting. In contrast, a customized analytics dashboard is primarily for corporations that require tailored solutions for data visualization, advanced analytics, and specific features, which necessitate a higher investment.
Dashboard Development in Different Industries and Key Metrics Examples
Analytics dashboards vary by industry; let’s consider some dashboard examples with key metrics they typically display.
| Retail Industry | Key Metrics Example |
|---|---|
| Dashboard Focus | Sales Performance, Inventory Management, Customer Behavior, Operational Efficiency |
| Conversion Rate (CR) | shows the percentage of visitors who complete a purchase, revealing whether your marketplace marketing efforts successfully convert traffic into revenue. |
| Average Order Value (AOV) | tracks how much customers spend on average per order, assessing your efforts and driving you to maximize each customer transaction value. |
| Customer Lifetime Value (CLV). | It estimates a customer’s total revenue over their relationship with your platform, helping build lasting relationships with customers. |
| Customer Retention Rate (CRR) | measures the percentage of customers who continue buying from you over time. The high figure indicates customer loyalty and, therefore, satisfaction with your products and services. |
| Customer Acquisition Cost (CAC). | It represents the cost of acquiring a new customer. Monitoring CAC helps you optimize spending on acquiring new customers is profitable. |
| Shopping Cart Abandonment Rate | shows the percentage of visitors who put goods to the cart without completing the purchase, enabling you to optimize and reduce cart abandonment. |
| Return on Ad Spend (ROAS) | measures your campaigns’ effectiveness by showing the revenue generated for each dollar spent. It helps you evaluate the profitability of your marketing efforts. |
| Channel Mix Metrics | tracks the performance of different marketing channels (e.g., email, social media, paid ads) to identify which channels drive the best traffic and conversions. |
| Real Estate | Key Metrics Example |
|---|---|
| Dashboard Focus | Property Performance, Sales, Client Management |
| Occupancy Rate | shows the percentage of rental properties occupied vs. vacant. |
| Rental Yield | measures the income generated from rental properties as a percentage to the property value. |
| Property Sale Price | tracks the average sale price of real estate in a given period |
| Lead Conversion Rate | shows the real estate percentage of leads that convert into sales or rentals. |
| Tenant Retention Rate | measures the percentage of tenants who renew their leases |
| Maintenance Costs | track the maintenance costs. |
| Human Resources (HR) | Key Metrics Example |
|---|---|
| Dashboard Focus | Employee Performance, Hiring, Retention |
| Employee Turnover Rate | measures the number of employees who leave the company in a given period. |
| Time to Hire | tracks the average time it takes to fill a vacant position. |
| Employee Satisfaction Score | identifies employee satisfaction through surveys and feedback. |
| Training and Development Rate | monitors employee participation in training programs and their progress. |
| Absenteeism Rate | tracks the percentage of workdays missed due to absenteeism. |
| Diversity Metrics | measures diversity in terms of gender, age, or ethnicity in the workplace. |
| Performance Reviews | tracks how employees are achieving set goals. |
Why Partner with LaSoft
We have worked in the market for 10+ years as a software development and dashboard development company and have a strong track record in building analytical dashboard solutions and other software development projects.
We strongly believe in Agile practices and manage our workflows and communication with the client, focusing on delivering solutions that meet our clients’ needs.
We provide dedicated support for our out-of-the-box analytics dashboard, ensuring smooth implementation, troubleshooting, and updates to keep it running effectively.
Final Insights
Data analytics dashboards are powerful tools to understand whether your digital marketing efforts, campaigns, and interactions with employees and clients lead to successful business activity. We encourage you to follow best practices and tips to create effective data analytics and strategic dashboards, gaining deeper insights into your business processes. It’s essential to define the type of widgets you need, visualize data to define goals and outcomes clearly, select the right data sources and tools, and design your dashboard with a clear and intuitive layout.
FAQ
What is the usage analytics dashboard?
What is a dashboard in data analytics?
How do I create a dashboard in analytics?
What are the three types of digital dashboards?
The three types of dashboards are:
Operational Dashboards: monitor real-time or near-real-time processes.
Analytical Dashboards: analyze large sets of data for trends and insights.
Strategic Dashboard: track key performance indicators (KPIs) to assess the progress of business objectives.
How to create a management dashboard that integrates seamlessly?
To create a solution, a dashboard development company should:
Define key management goals and metrics.
Choose an out-of-the-box or a custom dashboard that fits your business needs.
Connect relevant data sources and ensure data accuracy.
Select visualizations for intuitive dashboards to communicate management insights effectively through a unified interface.
Review with stakeholders for feedback and refinement, and offer ongoing support for customer satisfaction.