
There’s no doubt the e-commerce market is growing, and the numbers prove it. Sellers are constantly navigating multiple marketplaces in pursuit of growth and scaling. Yet with growth comes complexity: when you start juggling numerous marketplaces in the quest to discover new opportunities.
At Lasoft, we’ve been working with e-commerce businesses for more than 10 years, and we know that accuracy in data flow and having a unified, intelligent ecommerce dashboard solution customized to your unique needs can be a real game-changer in transforming chaos into order.
We’ll share the biggest challenges in today’s ecommerce industry, from process automation to managing finances and customer support, and explain how a dashboard solution can bring all this data together and elevate your workflows to the next level.
E-commerce Analytics Dashboard Glossary
| Dashboard development process |
The dashboard is a visual interface that presents metrics and performance indicators. Users can track, analyze, and get reports in real-time. Dashboards often include infographics and tables to present relevant datasets. |
| KPI | A measurable value indicates how effectively your business achieves business objectives. |
| Data visualization | It’s a graphical representation of information and data using visual elements to identify patterns, trends, and outliers. |
| Data mining | It’s the process of discovering patterns, correlations, and trends in large data sets using statistical and computational techniques. |
| Business intelligence (BI) | BI refers to technologies, processes, and tools used to collect, analyze, and present business information. |
| Drag-and-drop for dashboard | A drag-and-drop feature enables users to easily customize the layout of visual elements (charts, graphs, or widgets) by dragging them to any desired position. |
| Out-of-the-box dashboard | It refers to a pre-built, ready-to-use dashboard with standard features, visualizations, and configurations. It’s designed to work immediately upon installation or deployment without requiring extensive customization. |
| Widget library | A widget is a self-contained component or element within a dashboard displaying specific information or functionality. Widgets can include charts, graphs, gauges, tables, and text boxes. They are customizable and can be arranged on a dashboard for convenient use. As a user, you can pick a widget in the library that the LaSoft team developed and add it to your out-of-the-box analytic dashboard. |
Challenges E-commerce Businesses Face in Pursuit of Clients and Profit
Our firsthand experience shows that on-time KPI analysis is the foundation of better decision-making. All businesses rely on accurate insights to fuel growth, and e-commerce is no exception. Our developers offer a business intelligence solution for online retailers. It’s an out-of-the-box, AI-powered, low-code analytics digital product that enables companies to visualize their data without the high costs and extended time needed for traditional custom dashboard development.
Rather than switching between multiple platforms or spending hours consolidating reports, your top managers and teams can rely on a single, all-in-one dashboard to evaluate performance, monitor KPIs, and identify opportunities in real-time. Let’s list the challenges you face while being torn between marketplaces in the daily pursuit of new clients and sustainable profit:
1. Multi-channel Performance Tracking
Today’s successful sellers rarely depend on just one channel. Instead, they operate their own websites along with marketplaces like Amazon, eBay, Etsy, Shopify, Empik, or niche B2B platforms.
The challenge: each platform has its own reporting, fee structure, and rules. Manually reconciling these creates a logistical nightmare.
The result: fragmented data, duplicated effort, and missed opportunities.
2. Process Automation
As a business grows, the number of repetitive tasks increases: order processing, returns, refunds, shipment notifications, and status updates.
The challenge: many companies still handle these manually or rely on disconnected tools.
The result: wasted hours, higher error rates, and slower fulfillment.
3. Using AI and Data Effectively
Brands recognize the value of data-driven decisions, including predicting demand, segmenting customers, and personalizing offers. But without a unified data flow, insights remain scattered.
The challenge: dirty, siloed, or incomplete data prevents businesses from effectively applying AI or advanced analytics.
The result: poor forecasting and lost sales.
4. Financial Visibility and Cash Flow Management
We have here marketplace commissions, payment delays, refunds, currency conversions, and transaction fees.
The challenge: no real-time financial tracking forces management to fail to see what’s really profitable.
The result: cash flow blind spots and inaccurate planning.
5. Customer Support and Satisfaction
As order volumes grow, so do customer questions and complaints. 24/7 customer support and a timely response from your team bring customer satisfaction.
The challenge: handling support across multiple channels (email, chat, phone, social) without integration leads to slow response times.
The result: frustrated customers and damaged brand reputation.
6. Scalability and Real-Time Insights
Growth brings more data, more marketplaces, and more complexity. Yet many dashboards refresh slowly or only show partial information.
The challenge: without real-time, trustworthy insights, managers can’t make informed decisions.
The result: missed opportunities and lost clients.

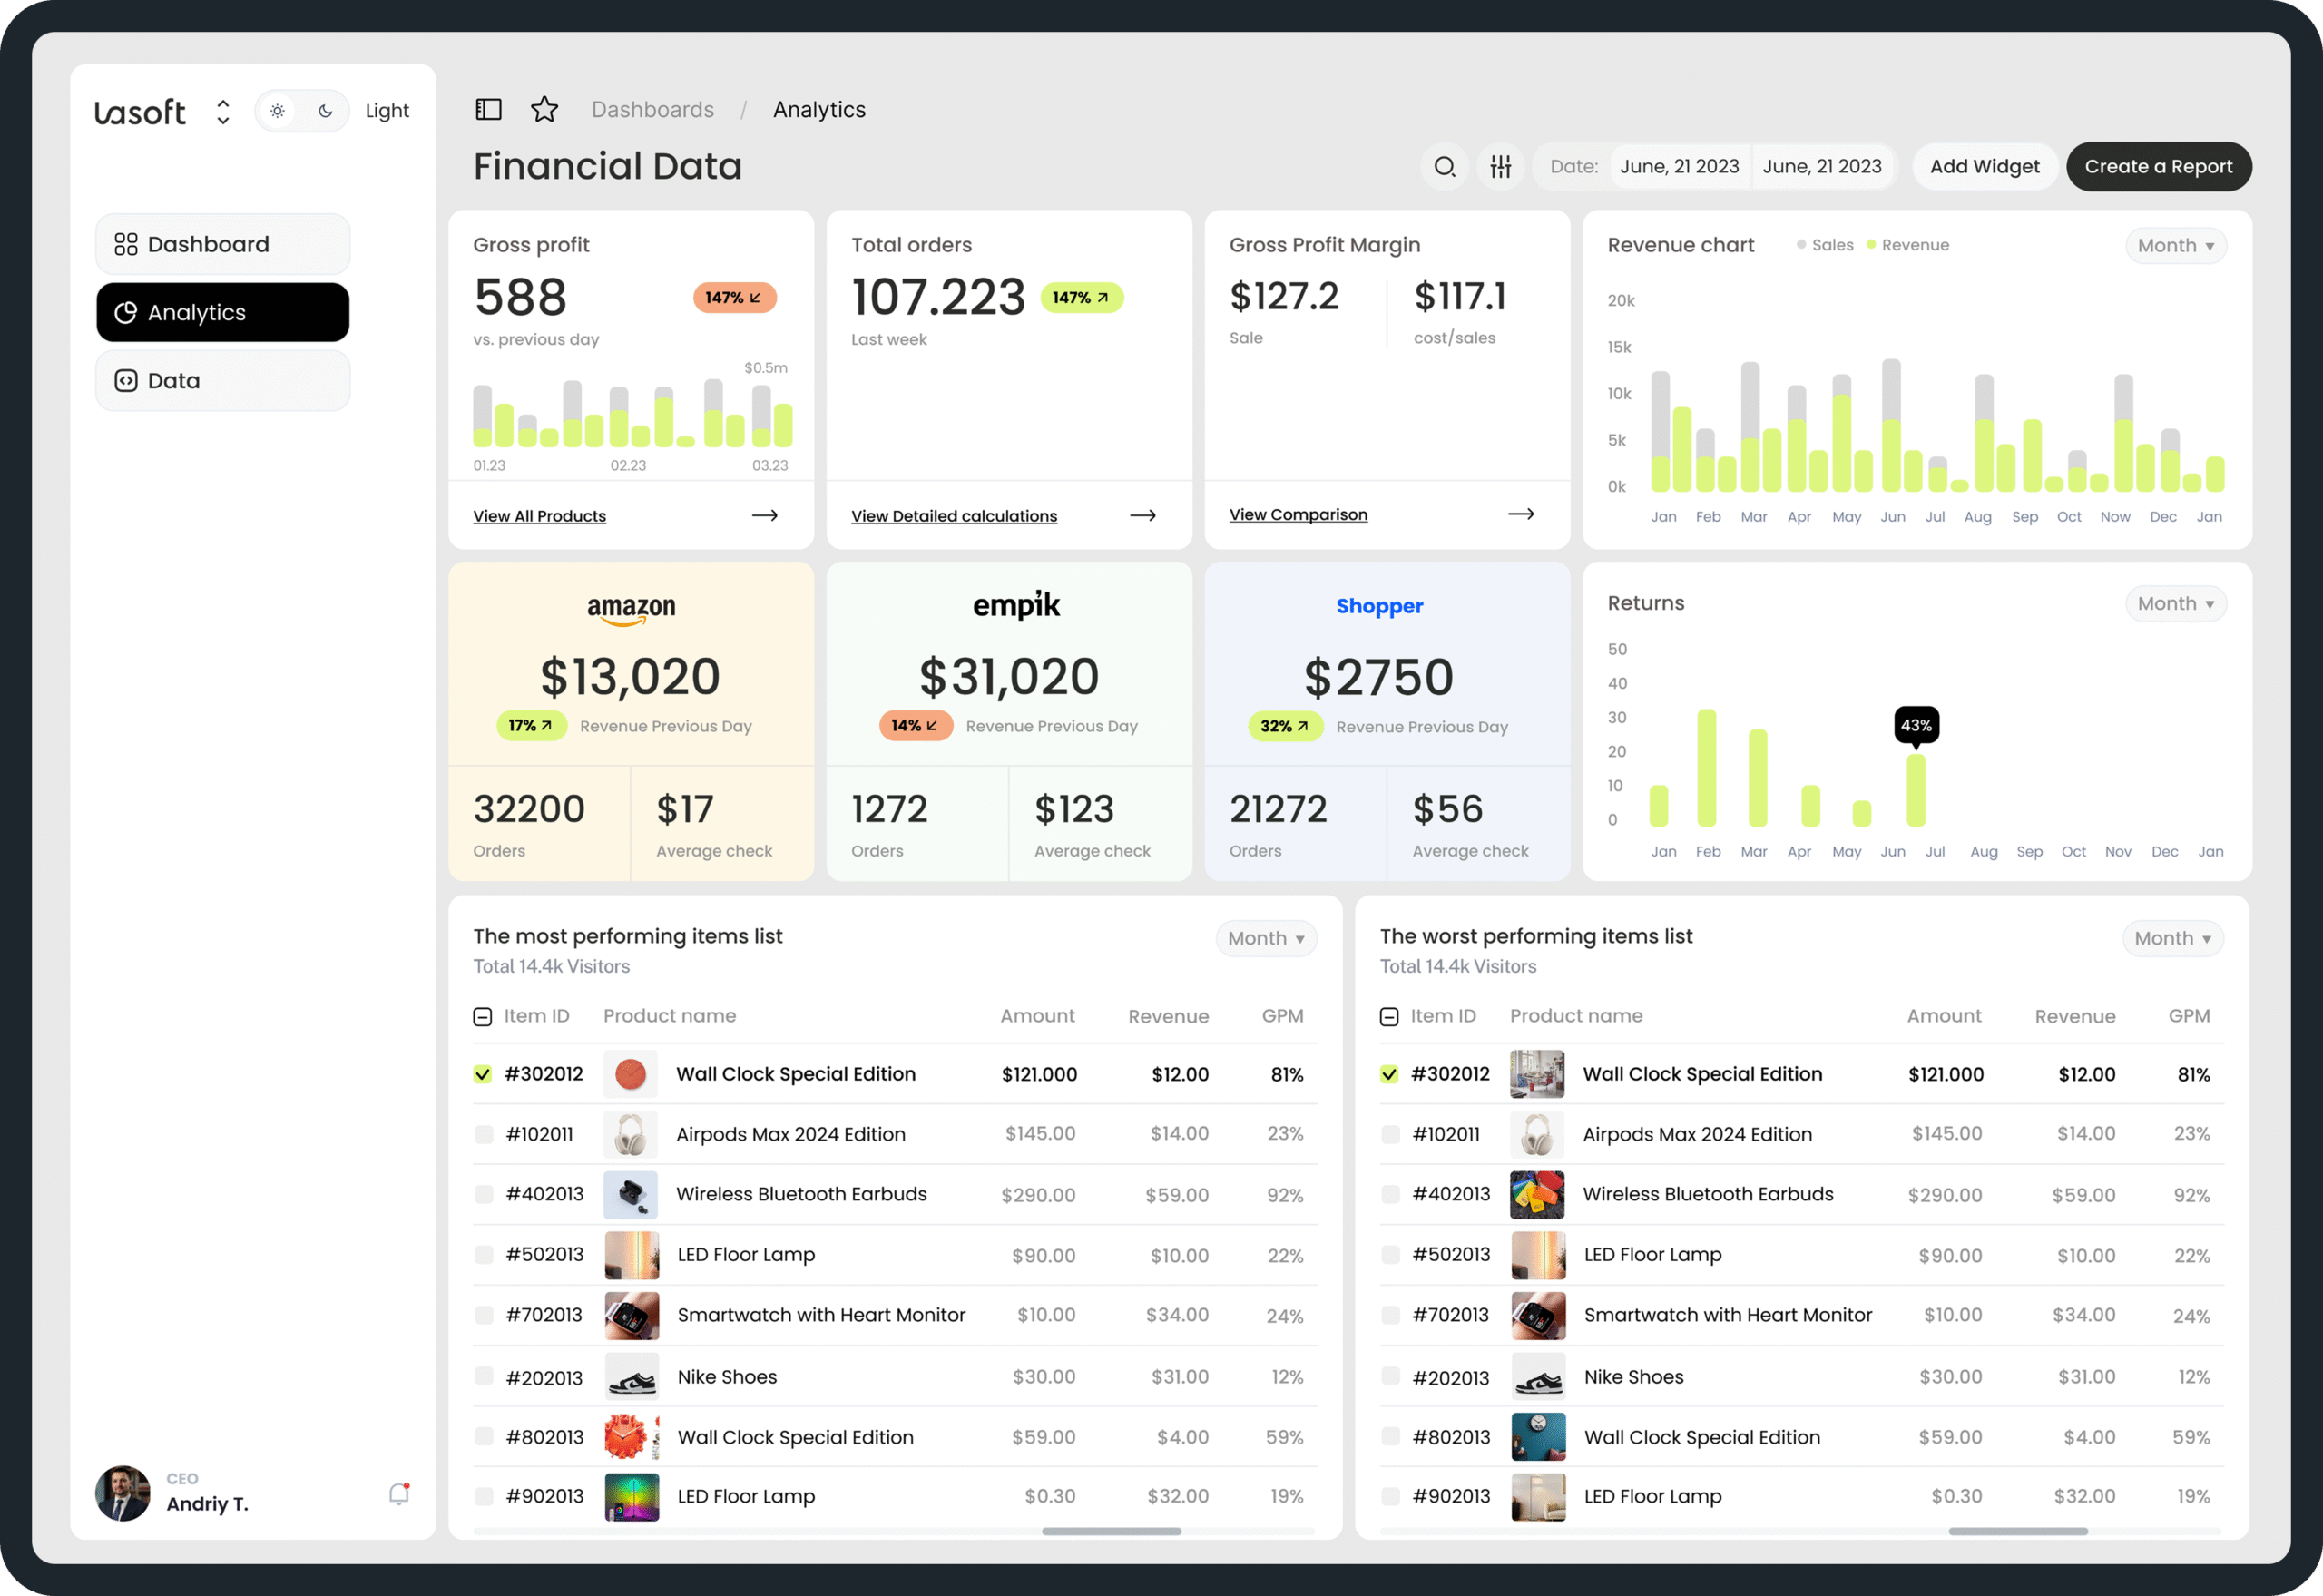
What is the DataPoint E-commerce Dashboard from Lasoft?
Our developers have created this BI tool as a customizable solution, built with e-commerce-specific features in mind. Designed to answer questions like
- Which channels are most profitable?
- What products are underperforming?
- Where should I restock?
- Which campaigns deliver the highest ROI?
- How do refunds and returns affect my net profit?
- Which regions or customer segments are most valuable?
- What inventory risks (stockouts or overstocks) are coming?
- How healthy is my cash flow across channels?
It turns raw data into actionable insights that help managers, teams, and stakeholders make decisions fast and confidently.
Best practices we used in the DataPoint solution from Lasoft
Non-tech users in mind: You don’t need a team of data scientists or developers. With a drag-and-drop dashboard builder and a rich widget library, DataPoint enables executives and operational staff to select the views they need without writing code.
Multi-channel integration: It collects data across all your sales channels, including Shopify, WooCommerce, Amazon, Etsy, and various marketplaces, as well as marketing tools, CRMs, spreadsheets, and databases.
Real-time insights and filtering: DataPoint delivers data that refreshes in real time (or near-real time), with dynamic filters by product, channel, country, etc., so you can drill down instantly where needed.
Metrics tailored for e-commerce: Track what matters: gross vs. net revenue, campaign ROI, inventory health (stockouts, turnover, returns), product performance, customer behavior, and predictive analytics (forecasting, risk of stockouts, etc.).
Implementation and support: The rollout process is when LaSoft starts with discovery (goals, user roles), validates data sources, designs dashboards, rolls them out live, then provides onboarding (two-day training) and ongoing support.
Affordable and scalable: Designed to support businesses of all sizes, from growing SMBs to large enterprises, that can afford and benefit from using DataPoint. The built-in widget library, no-code/low-code interface, real-time filtering by campaign, product category, or customer groups, automated alerts, and scheduled emails/SMS, we’ve built an effective solution to scale as your business grows.
How DataPoint Compares with Other Dashboard Solutions
| Solution Type | Pros | Cons / What they often lack | How DataPoint compares/beats them |
| Generic BI/analytics tools (Tableau, Power BI, Looker Studio, etc.) | Flexible, interactive visualizations, strong calculation ability. | Require manual setup, many integrations, can be expensive; not built for ecommerce workflows out of the box. | DataPoint is built for e-commerce: various marketplace integrations, built-in workflows, and less setup needed. |
| Marketplace dashboards (Amazon Seller Central, Shopify dashboards, etc.) | Deep insights into that one channel; often reliable. | Only covers that channel; no unified view; manual reconciliation across channels remains needed. | DataPoint pulls all channels into a unified view, automates reconciliation, etc. |
| Niche ecommerce dashboard tools /analytics tools | Provide metrics like conversion, customer behavior, etc., which may include marketing insights. | Often lacks in-depth financial flow automation, customer support workflows, or multichannel money reconciliation; may not be real-time or customizable enough. | DataPoint intends to combine those features: finances, operations, support, integrations, notifications, and alerts in real time. |
| Customer support tools separately | Specialized in support, ticketing, and automations for queries. | Not closely connected to sales, inventory, or finances. | DataPoint integrates support workflows connected to actual sales, order status etc. |
You could also compare based on price, ease of implementation, user experience, support etc. Emphasize how DataPoint is especially suited for e-commerce businesses that sell on many channels, need tight control of cash flow, want automation, and want one dashboard where many operations converge.
Dashboard Development in Different Industries and Key Metrics Examples
Analytics dashboards vary by industry; let’s consider some essential ecommerce metrics they typically display.
| Retail Industry | Key Metrics Example |
| Dashboard Focus | Sales Performance, Inventory Management, Customer Behavior, Operational Efficiency |
| Conversion Rate (CR) | shows the percentage of visitors who complete a purchase, revealing whether your marketplace marketing efforts successfully convert traffic into revenue. |
| Average Order Value (AOV) | tracks how much customers spend on average per order, assessing your efforts and driving you to maximize each customer transaction value. |
| Customer Lifetime Value (CLV). | It estimates a customer’s total revenue over their relationship with your platform, helping build lasting relationships with customers. |
| Customer Retention Rate (CRR) | measures the percentage of customers who continue buying from you over time. The high figure indicates customer loyalty and, therefore, satisfaction with your products and services. |
| Customer Acquisition Cost (CAC). | It represents the cost of acquiring a new customer. Monitoring customer acquisition cost helps you optimize spending on acquiring new customers to determine if it is profitable. |
| Shopping Cart Abandonment Rate | shows the percentage of visitors who put goods in the cart without completing the purchase, enabling you to optimize and reduce cart abandonment. |
| Return on Ad Spend (ROAS) | measures your campaigns’ effectiveness by showing the revenue generated for each dollar spent. It helps you evaluate the profitability of your marketing efforts. |
| Channel Mix Metrics | tracks the performance of various marketing channels (e.g., email, social media, paid ads) to determine which channels generate the most effective traffic and conversions. |
| Click-Through Rate (CTR) | Measures the percentage of users who click on your ads or product links compared to the total number of impressions. |
| Cost per Click (CPC) | Helps evaluate the efficiency of paid advertising campaigns. |
| Email Open and Conversion Rates | Helps evaluate the efficiency of paid advertising campaigns. |
| Social Media Engagement Metrics | Monitors likes, shares, comments, and referrals from social platforms. |
| Ecommerce Site Traffic Sources | Breaks down the sources of traffic, including organic search, paid ads, social media, and referrals. |
Global E-commerce Statistics: Identify Trends to Inspire
According to trade.gov, the B2C e-commerce sector is projected to reach USD 5.5 trillion by 2027, with a growth rate of ~14.4% annually. Meanwhile, the B2B side is even larger, expected to reach USD 36 trillion by 2026, with the Asia-Pacific region alone accounting for approximately 80% of that market. With stakes this high, relying on basic systems or manual processes is no longer viable. Sellers and brands will increasingly look for unified, intelligent software solutions (like ecommerce dashboards) to scale effectively.
Let’s summarize some data we have as figures speak louder than words (source: Shopify):
| Important metrics | Value | Projection / Trend |
| Global ecommerce business 2025 | ~$4.8T | ~$9T by 2032 |
| Global B2C revenue growth rate | ~14-15% annually | Expected growth |
| E-commerce share of retail in leading markets (e.g., the US) | ~23% by 2027 | Climbing steadily |
| Number of shoppers/regions growing fastest | Latin America (including Peru, Brazil, Argentina, Chile, Colombia, and Mexico), the Philippines, etc. | High adoption & mobile penetration |
Drivers for E-commerce Growth
Several key factors drive the rapid growth of the global e-commerce industry. Let’s summarize those trends. First, the widespread use of the internet and smartphones has provided consumers with instant access to online stores, allowing companies to reach audiences well beyond traditional geographical boundaries.
Modern shoppers value the ability to browse, compare, and buy products anytime, driving the trend we can name here as the “24/7 marketplace.” This trend has reshaped consumer expectations and sped up digital adoption.
The development of secure, user-friendly online payment systems has also increased trust in digital transactions, making customers more confident about shopping online. Meanwhile, advanced data analytics and personalization tools have enabled businesses to offer customized shopping experiences, from product recommendations to special promotions.
Ultimately, the merging of digital marketing strategy and social media has become a powerful growth driver. Brands can now collaborate directly with audiences and foster customer loyalty through personalized interactions, boosting sales with targeted campaigns. All these factors explain why e-commerce marketing campaigns continue to drive online businesses, which is why companies seek solutions like an e-commerce dashboard to handle the complexity of sales funnels, monitor campaign performance, and attract new customers by checking marketing metrics and ecommerce KPIs.
What are the Types of Custom Ecommerce Dashboards?
Dashboard development companies offer various types of e-commerce dashboards to track key metrics of e-commerce activity. Common dashboard types:
Web traffic dashboard: Displays customer demand and monitors the platform’s performance. Tracks visits, session length, bounce rate, and more. Breaking down traffic by source (customer segmentation, cohort analysis, organic search, paid ads, social media, etc.) reveals which channels and campaigns are effective. When you combine traffic with funnel data, you can see where visitors drop off and why. Technical metrics, such as page load time and error rate, help improve KPIs and user behavior. Real-time monitoring and alerts let teams respond to spikes or outages.
Ecommerce sales trends dashboard: Used by ecommerce managers, marketers, and finance to monitor revenue, ecommerce performance, and customer experience. Automates reporting so teams are aligned on trends, product performance, and buying patterns. Shows sales by day, week, month, or quarter, top products, average order value, and margins for a quick health check. Filters show which channels (website, marketplaces, social) generate the most revenue, so you can better market and plan your inventory. Customer segments (new, repeat, loyal) support retention and upsell efforts. Profitability views, including gross margin and cost of goods sold, go beyond top-line sales.
Supply chain dashboard: Gives operations and logistics a view of product movement and supplier performance for ecommerce teams. Helps track fulfillment efficiency, catch disruptions early, and deliver more reliably. Key metrics include supplier lead time, delivery accuracy, defect rate, shipping accuracy, and cycle time, which expose data silos and unnecessary steps that increase costs or slow down the delivery process. It can display inventory in transit and trigger alerts for delays, shortages, or cost overruns, such as rising shipping fees or storage costs. Tracking supplier trends over time helps you identify reliable partners and address recurring issues, enabling you to negotiate more effectively and experience fewer disruptions.
Inventory management tools and dashboards: Helps operations, logistics, and purchasing monitor stock levels and readiness to fulfill orders. Shows current stock, reorder points, and overall inventory health across locations. Tracks turnover, aging stock, and days of inventory on hand to avoid overstock and stockout. Automated reorder thresholds can create purchase orders when inventory levels are low so you don’t have to. For multi-warehouse businesses, regional views enable you to deliver faster and more cost-effectively. It can also track returns, shrinkage, and damaged goods to provide a comprehensive view of inventory health. When combined with carrying and landed cost (product cost plus shipping, taxes, and fees), you can make more informed pricing and purchasing decisions.
Conclusion
The ecommerce market is growing fast, and all retailers are asking themselves: how to grow, how to navigate the complexity, and how to build effective sales funnels. Sellers are under pressure when juggling multiple marketplaces, fragmented reporting, and managing increasing volumes of orders, finances, shipping costs, and customer interactions. Without a single view, businesses are inefficient with blind spots and missed opportunities.
DataPoint and Ecommerce Metrics FAQs
dev How is DataPoint different from tools like Tableau or Power BI?
Can DataPoint integrate with multiple sales channels?
How does DataPoint help with cash flow management?
Is DataPoint for small businesses?
What support does LaSoft provide after implementation?
What are the key business metrics for ecommerce?
What are the 4 types of dashboards?
Can ChatGPT create a dashboard?
What is e-dash commerce?
What is the average customer lifespan?
What is the sales conversion rate?
How do you measure an online store?
What is an ecommerce marketing dashboard?
How do I measure the success of Google Ads in ecommerce?