check out our
Data Analytics & Data Visualization case studies
Since 2014, the LaSoft team has been implementing data analytics and data visualization services across diverse sectors, including insurance, telecommunications, human resources, recruitment, marketing, healthcare, real estate, education, sports tech, and many others.
Check our worksOur data analysis expertise enables companies to gain deeper insights into their customer base, evaluate campaign performance, personalize content, and refine product development strategies. Our user-friendly data visualizations empower stakeholders to interpret and utilize analyzed data, enabling them to respond promptly to any market changes.
get valuable insights
Why data analytics and visualization matter
take proactive
actions
Dashboards aren’t just “pretty charts.” They're how businesses track what’s really happening. When built properly, data dashboards help teams move faster, spot inefficiencies, and act based on facts, not assumptions.
At LaSoft, we don’t build reports for the sake of reports. We help companies define what questions they’re trying to answer, and then we design tools that visualize the answers in a clear, actionable way.

Where this approach works best:
- Logistics companies managing real-time operations
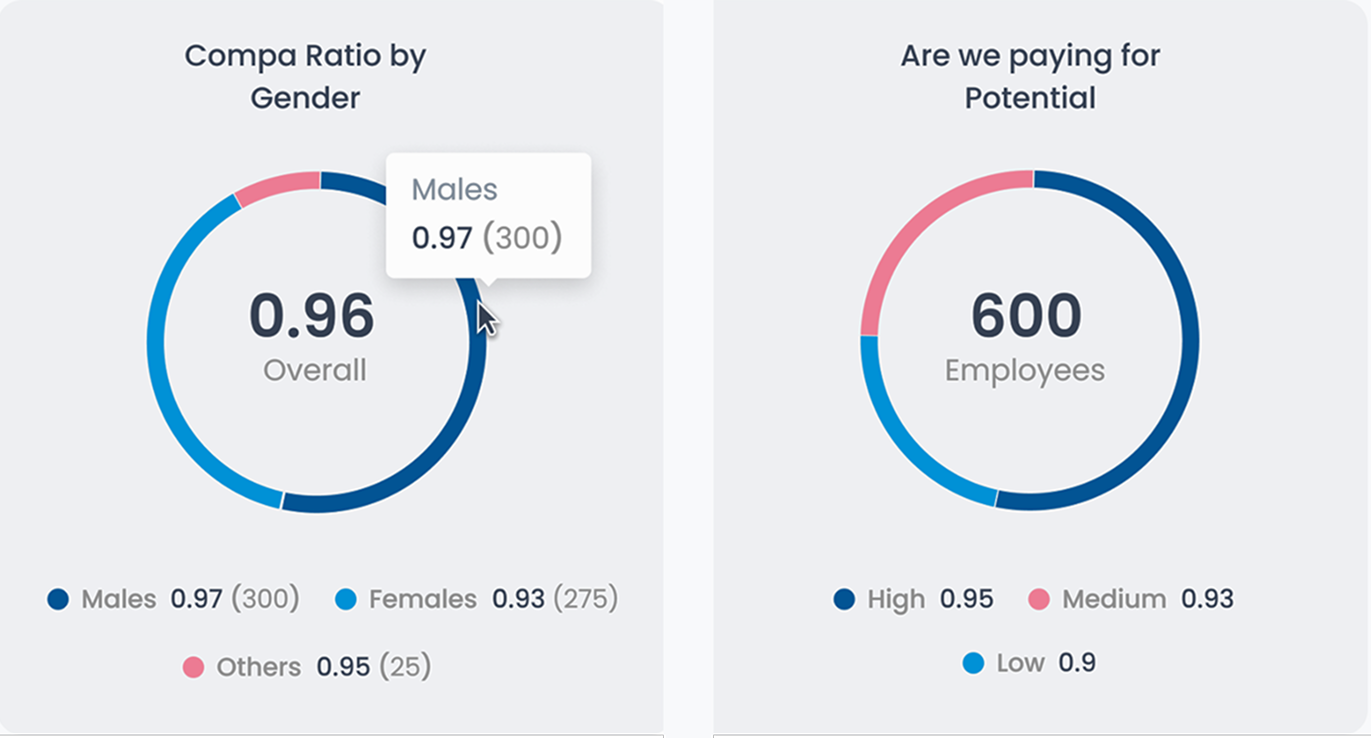
- HR teams tracking performance and engagement
- Finance teams monitoring KPIs and anomalies
- Startups, which want to understand user behavior and product usage
Our high-value cases to prove team's expertise
Our extensive experience in developing data analytics platforms and custom dashboards helps with real-time visibility into operations, performance, and customer behavior.
one-stop-shop software development company
full list of services
A wide range of
services
Software Project Estimation
Let's turn ideas into actionable plans with accurate budget estimates. Our AI-powered tools help you plan effectively by outlining the resources you need for its implementation.
Custom Software Development
Get beautiful and easy-to-use software that will improve the performance of your business or even disrupt an entire industry.
Web Development
We have extensive expertise in delivering complex projects and ensuring our clients receive beautiful, custom web applications after working with our professional teams.
AI/ML Software Development
Want to embed innovative technologies into your IT infrastructure? From chatbot development to AI system integration, we transform business operations into automated workflows.
MVP Development
Have a business idea? Start with a Minimum Viable Product. It allows you to test the concept's viability and save you from the hassle associated with significant investments in creating a full-fledged digital product.
Dashboard Development
We have extensive knowledge in developing high-load dashboards with modern infographics. Dashboards we build help our clients make thorough decisions.
Software Audit
Our team is ready to help you identify risks, detect inefficiencies, and provide clear, actionable recommendations. Let's future-proof your software and encourage sustainable business growth.
Digital Product Design
We create a design that users want to interact with. Our experienced designers create beautiful digital designs for web and mobile applications with beautiful user experiences.
Dedicated Teams
Hire a world-class, highly-productive professional development team for your digital project.
Mobile Development
Make your business closer to your clients through a mobile app (Android and IOS) and improve clients’ engagement as a reward.
We have answers for you
frequently asked questions
What kinds of dashboards do you build?
Depends on what you need. Some clients want executive overviews. Others require operational tools that are updated in real-time. We’ve built both and everything in between.
Can you build a Data Warehouse for us?
Yes. We design and implement data warehouses that match your business logic, whether you're consolidating multiple data sources or preparing for future analytics and BI needs. We can set up the architecture, build the pipelines, and help define what belongs in your data warehouse (DWH) and why.
Can you pull data from multiple sources?
Definitely. We can integrate data from CRMs, ERPs, accounting software, or even Google Sheets, and centralize it in one interface.
Will our non-technical team members be able to understand the dashboards?
That’s the point. We design for usability. Our dashboards are clean, clear, and structured around how your team works.
Can we update the data automatically?
Yes. We support automated data pipelines, scheduled refreshes, and alerts when something needs attention.
Is our data secure?
We follow security best practices and deploy within your infrastructure (on-prem or cloud). No third-party leaks, no surprises.
What’s your typical turnaround time?
Small dashboards take a few weeks. Larger analytics platforms take a couple of months. We'll give you a realistic estimate based on the scope.
Can you help us figure out what to track?
Yes. We often begin by helping clients define useful metrics and key performance indicators (KPIs) before we start building anything. Clarity comes first, then design.